Introduction
Understanding how to read forex price charts is essential for any serious trader. The forex market operates 24 hours a day, five days a week, making it one of the most liquid and dynamic markets in the world. Price movements happen rapidly, and without a solid grasp of how to interpret charts, it’s easy to get lost in the volatility. In this guide, I’ll walk you through the fundamentals of forex charts, the different types available, and how to analyze them to make informed trading decisions. I’ll also provide historical context, practical examples, and essential tools that will help you trade like a pro.
Types of Forex Charts
Forex traders primarily use three types of charts: line charts, bar charts, and candlestick charts. Each has its strengths and weaknesses, depending on your trading style and objectives.
1. Line Charts
A line chart is the most basic type of forex chart. It connects closing prices over a set period, forming a continuous line. This type of chart is useful for identifying trends but lacks detailed price movement information.
Example:
Imagine the EUR/USD pair has the following closing prices over five days:
| Day | Closing Price |
|---|---|
| 1 | 1.1050 |
| 2 | 1.1075 |
| 3 | 1.1040 |
| 4 | 1.1100 |
| 5 | 1.1080 |
A line chart would plot these prices and connect them, showing the general trend.
2. Bar Charts
A bar chart provides more information than a line chart. Each bar represents the open, high, low, and close (OHLC) prices for a given period. This makes it easier to see price fluctuations within each time frame.
Example:
If we look at an hourly bar chart for EUR/USD, one bar might show:
- Open: 1.1060
- High: 1.1095
- Low: 1.1045
- Close: 1.1080
| Time Frame | Open | High | Low | Close |
|---|---|---|---|---|
| 10:00 AM | 1.1060 | 1.1095 | 1.1045 | 1.1080 |
A bar with a close higher than the open indicates upward momentum, while a lower close suggests downward momentum.
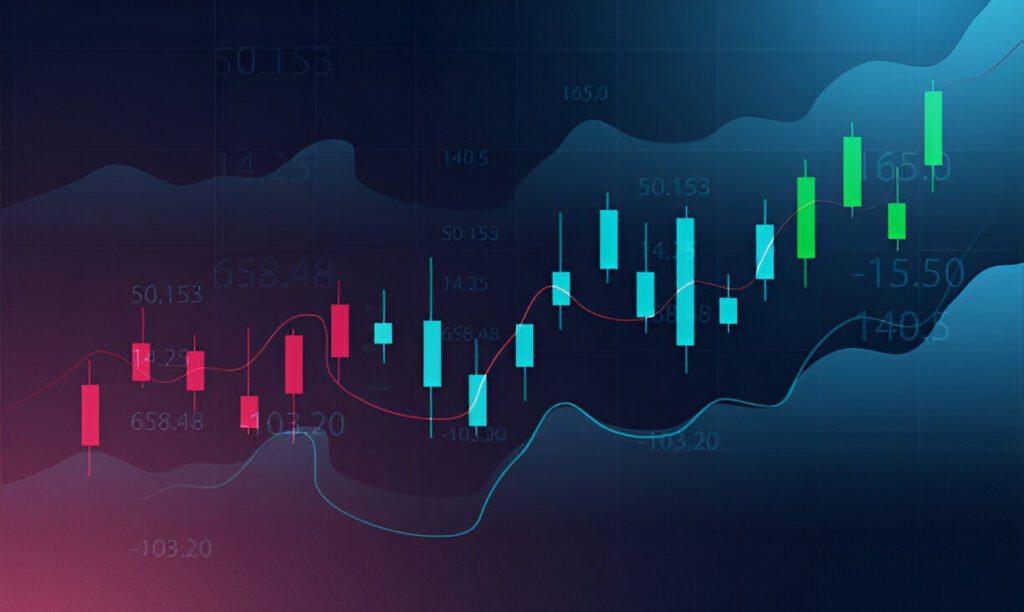
3. Candlestick Charts
Candlestick charts offer the same OHLC information as bar charts but present it in a visually more informative way. The body of the candlestick is colored—green for bullish (higher close than open) and red for bearish (lower close than open).
Example:
A candlestick chart for EUR/USD may show:
- Bullish Candle: Open at 1.1060, Close at 1.1095, High at 1.1100, Low at 1.1050.
- Bearish Candle: Open at 1.1095, Close at 1.1065, High at 1.1110, Low at 1.1060.
| Candle Type | Open | High | Low | Close |
|---|---|---|---|---|
| Bullish | 1.1060 | 1.1100 | 1.1050 | 1.1095 |
| Bearish | 1.1095 | 1.1110 | 1.1060 | 1.1065 |
Candlestick patterns, such as doji, hammer, and engulfing patterns, can signal potential reversals or continuations.
Key Chart Indicators
To refine trading decisions, traders use indicators that help identify trends, momentum, and volatility.
1. Moving Averages (MA)
A moving average smooths price data to identify trends. The two common types are:
- Simple Moving Average (SMA): A basic average over a set period.
- Exponential Moving Average (EMA): Puts more weight on recent prices.
Example:
\text{SMA} = \frac{(1.1000 + 1.1020 + … + 1.1200)}{10}2. Relative Strength Index (RSI)
RSI measures price momentum on a scale of 0-100. An RSI above 70 indicates an overbought market, while below 30 suggests an oversold market.
3. Bollinger Bands
These bands consist of a moving average with an upper and lower band representing standard deviations. When price touches the upper band, it may be overbought; when it hits the lower band, it may be oversold.
Historical Perspective: Lessons from Market Events
Understanding historical forex events helps traders anticipate future movements. Take, for example, the 2015 Swiss Franc Shock. When the Swiss National Bank removed its currency peg to the euro, the EUR/CHF pair dropped nearly 30% within minutes. Traders who had read chart signals beforehand noticed unusual volatility before the announcement.
Conclusion
Reading forex price charts is a fundamental skill that separates successful traders from amateurs. Whether using line, bar, or candlestick charts, understanding how to interpret price movements, spot patterns, and use technical indicators can significantly improve trading decisions. By analyzing historical price trends and incorporating statistical tools, traders can navigate the forex market with greater confidence. Mastering these skills takes time, but with consistent practice, anyone can learn to read forex price charts like a pro.